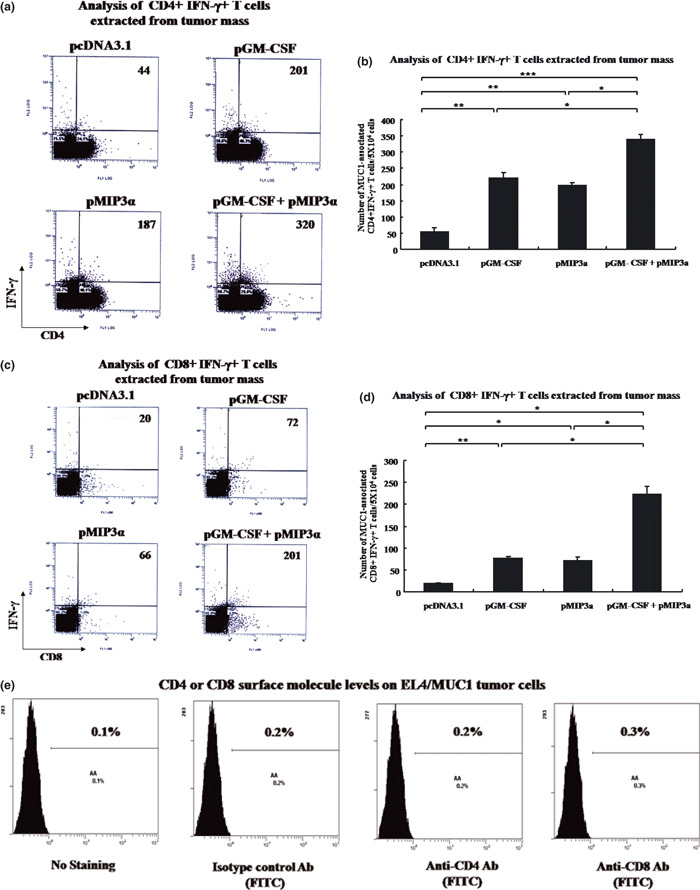
Figure 5.

Analysis of T cells extracted from tumor masses. (a) Representative set of flow cytometry data. (b) Columns contain mean numbers of MUC1‐associated IFN‐γ‐secreting CD4+ T cells per 5 × 10⁴ cells. *P < 0.001. **P < 0.0005. ***P < 0.00005. (c) Representative flow cytometry data. (d) Columns contain mean numbers of MUC1‐associated interferon‐γ‐secreting CD8+ T cells per 5 × 10⁴ cells. *P < 0.005. **P < 0.001. (e) CD4 or CD8 surface molecule levels on EL4/MUC1 tumor cells. A representative result of three experiments is shown. Bars are means ± SD. Five mice were examined per group. Ab, antibody; pGM‐CSF, plasmid granulocyte macrophage colony stimulating factor; pMIP3α, plasmid macrophage inflammatory protein‐3 alpha.
