
Figure 1.
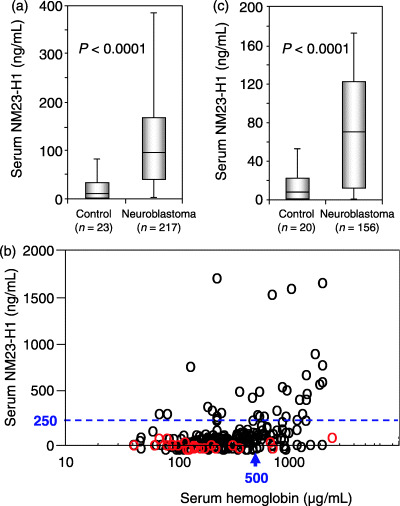
Serum NM23‐H1 levels in patients with neuroblastoma and in control children. (a) Box plots of NM23‐H1 serum levels for 217 patients with neuroblastoma and 23 control children with any serum hemoglobin levels. (b) Relationship between the serum levels of NM23‐H1 and hemoglobin in all samples examined (black circles, neuroblastoma patients [n = 217]; red circles, control children [n = 23]). (c) Box plots of NM23‐H1 serum levels for 156 patients with neuroblastoma and 20 control children with serum hemoglobin levels less than 500 µg/mL.