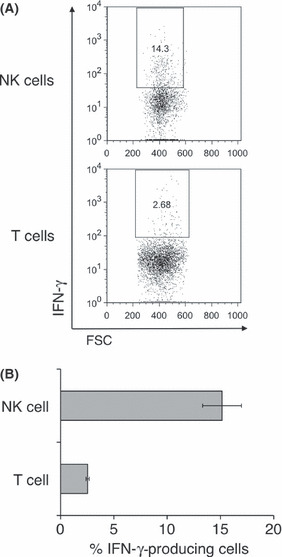
Figure 4.

Early interferon (IFN)‐γ production of natural killer (NK) cells in MCA205 tumor. B6 mice were inoculated s.c. with MCA205 fibrosarcoma (4 × 10⁵) and tumors were harvested 1 week after inoculation. Tumor‐infiltrating lymphocytes (TIL) were isolated and then incubated with Golgistop for 2 h without any in vitro stimulation. Cells were subjected to flow cytometry analysis to determine the intracellular level of IFN‐γ. (A) The dot plots show the population of IFN‐γ‐producing cells in TIL electronically gated on NK cells (NK1.1+ CD3−) or T cells (NK1.1− CD3+). (B) The proportion of IFN‐γ‐producing cells from NK cells or T cells is shown. The data represent the mean ± SEM and are representative of two experiments (n = 5 mice). FSC, forward light scatter.
