
Figure 1.
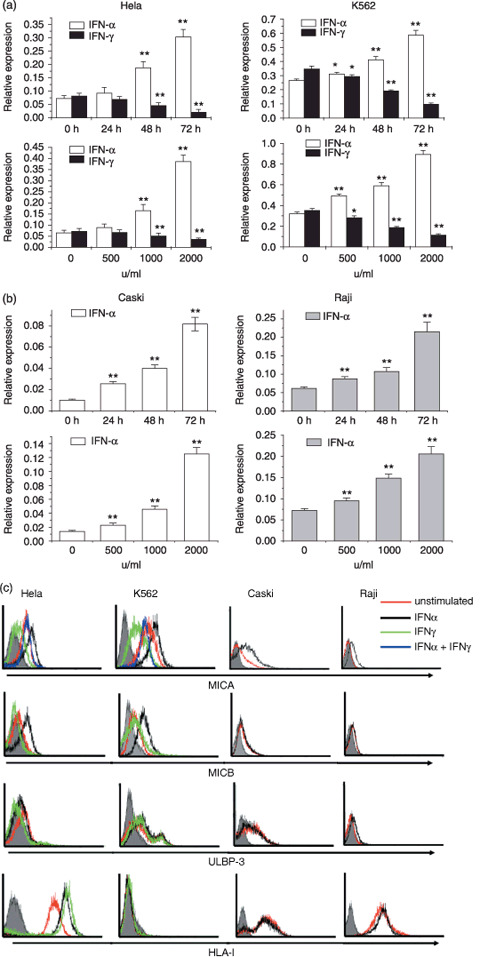
Effect of interferon (IFN)‐α or IFNγ on the expression of major histocompatibility complex class I‐related chain (MIC) A in tumor cell lines. (a) Real‐time polymerase chain reaction (PCR) analysis of MICA mRNA in Hela and K562 cell lines. Hela and K562 cells were starved for 4 h in serum‐free medium and then cocultured with 1000 u/mL IFNα or IFNγ for 0, 24, 48, and 72 h separately or stimulated with different dosages of IFNα or IFNγ for 48 h separately. Then, transcripts of MICA were measured by real‐time PCR. The relative expression of mRNA was normalized to that of β‐actin. (b) Expression of MICA mRNA in Caski and Raji cell lines. Caski and Raji cells were starved for 4 h and then treated with 1000 u/mL IFNα for 0, 24, 48, and 72 h or stimulated with different dosages of IFNα for 48 h, respectively. The relative expression of mRNA was normalized to that of β‐actin. (c) FACS analysis of natural killer group 2D ligands (MICA, MICB, UL16‐binding protein [ULBP3]) and human leukocyte antigen (HLA) class I molecule expression on untreated tumor cell lines and treatment with 1000 u/mL IFNα or IFNγ for 72 h. Shaded histograms, isotype control stainings; red lines, staining of unstimulated cells; black lines, expression of IFNα‐treated cells; green lines, expression of IFNγ‐treated cells; blue lines, expression of cells exposed first to IFNα and then to IFNγ stimulation. All experiments were repeated three times with the representative experiment shown here. Values are shown as mean ± SEM. *P < 0.05, **P < 0.01 versus unstimulated control (0 h or 0 u/mL).