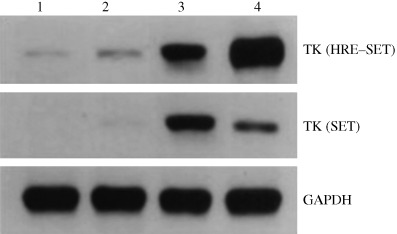
Figure 3.

HSV‐tk expression in parental and infected A549 cells. The HSV‐tk of the SET and HRE–SET groups and glyceraldehyde‐3‐phosphate dehydrogenase (GAPDH)‐specific transcripts are shown. Lane 1, untreated infected cells at normoxia; lane 2, infected cells under hypoxia (1%); lanes 3–4, infected cells exposed to 2 Gy radiation with or without hypoxia (1%), respectively.
