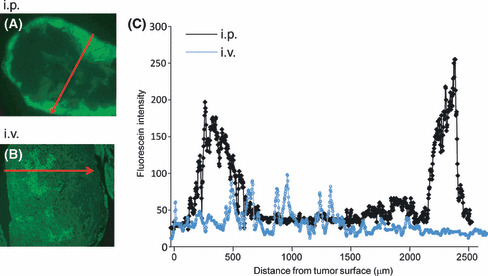
Figure 2.

Intratumoral fluorescein intensity in peri‐toneal tumor at 24 h after i.p. and i.v. injection of paclitaxel nanoparticles (PTX‐30W). A representative line, which appears to reflect the deepest infiltration of green PTX, was set as the red arrow in sections of peritoneal tumors (A: i.p., B: i.v. administration), and the fluorescence intensity was measured on the line and plotted. The distance of the deepest infiltration of PTX after i.p. injection in each tumor is shown in Figure 2C.
