
Figure 1.
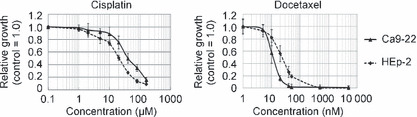
Growth curve after 1‐h drug exposure followed by a 96‐h incubation in cisplatin or docetaxel treatment. Control cell growth = 1.0. Each data point represents mean ± SE.
Official websites use .gov
A
.gov website belongs to an official
government organization in the United States.
Secure .gov websites use HTTPS
A lock (
) or https:// means you've safely
connected to the .gov website. Share sensitive
information only on official, secure websites.
Growth curve after 1‐h drug exposure followed by a 96‐h incubation in cisplatin or docetaxel treatment. Control cell growth = 1.0. Each data point represents mean ± SE.