
Figure 1.
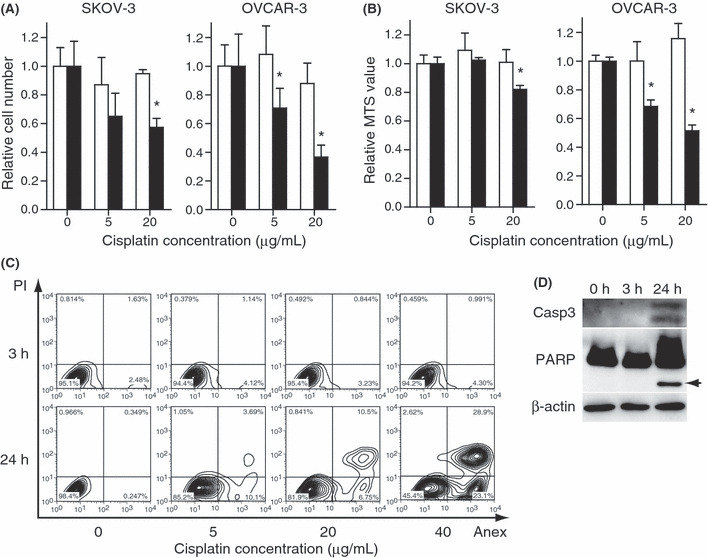
SKOV‐3 cells and OVCAR‐3 cells were treated with cisplatin at the indicated doses. (A) Cell viability assessed by counting the number of viable cells or (B) the MTS assay. The values are relative to the untreated control group. The white bars indicate 3 h and black bars 24 h after cisplatin treatment. The results are the normalized mean values for three independent replicates. The experiments were repeated three times, and representative results are shown. *P < 0.05 compared with the control. (C) The apoptotic events for SKOV‐3 were assessed by flow cytometry with annexin V/PI staining and (D) western blot for the cleaved form of caspase‐3 and poly‐ADP‐ribose polymerase (PARP) (arrow). The cisplatin concentration was 20 μg/mL.