
Figure 2.
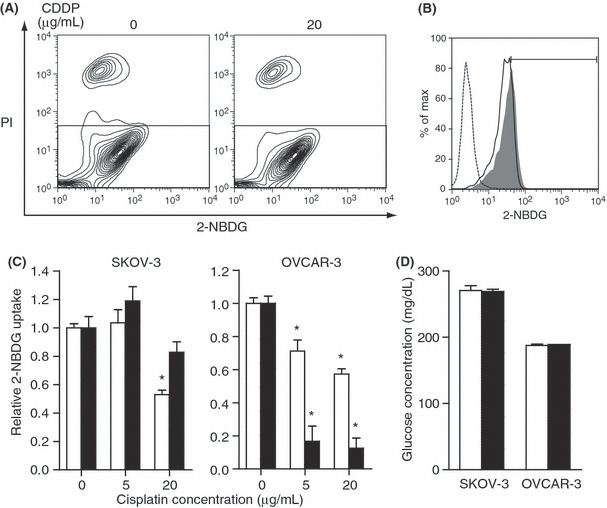
Glucose uptake was evaluated by cellular 2‐[N‐(7‐nitrobenz‐2‐oxa‐1,3‐diaxol‐4‐yl) amino]‐2‐deoxyglucose (2‐NBDG) uptake was determined using flow cytometry. (A) OVCAR‐3 cells were treated with cisplatin at the indicated doses. The scatter plots of the 2‐NBDG and propidium iodide (PI) fluorescence intensity 3 h after treatment are shown. To exclude dead cells, the gate in the lower rectangle was applied for further analysis. (B) Histogram for the same samples in (A). The y‐axis represents the percentage of maximum cell number counts (Max); the x‐axis represents 2‐NBDG fluorescence intensity. The dotted line indicates untreated cells, the gray shading indicates untreated cells with 2‐NBDG, and the solid line indicates cisplatin (20 μg/mL)‐treated cells with 2‐NBDG. In the untreated cells, those showing more 2‐NBDG fluorescence intensity than the histogram peak were gated to represent 2‐NBDG uptake. (C) SKOV‐3 cells and OVCAR‐3 cells were treated with cisplatin at the indicated doses. The 2‐NBDG uptake relative to the untreated group is shown. The white bars indicate 3 h and black bars 24 h after cisplatin treatment. The results are from three independent replicates. The experiments were repeated three times, and representative results are shown. *P < 0.05 compared with the control. (D) Glucose concentration of the medium. Cells were treated with 20 μg/mL cisplatin. The white bars indicate 0 h and black bars 3 h after cisplatin treatment. The results are from three independent replicates. The experiments were repeated three times, and representative results are shown.