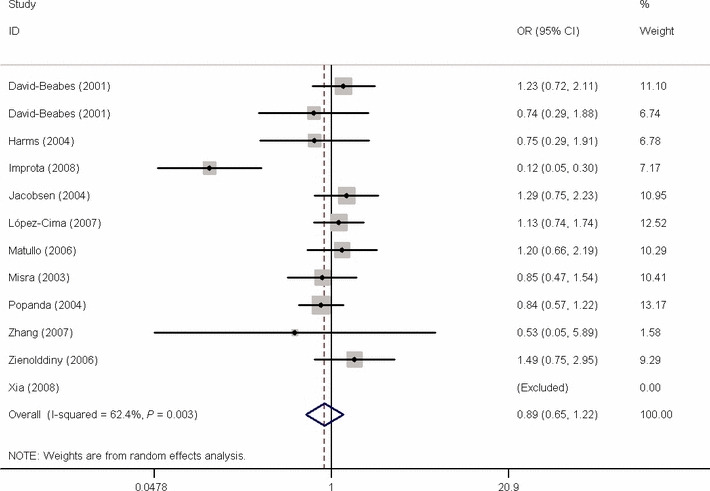
Figure 1.

Forest plot of OR of lung cancer risk associated with X‐ray repair cross‐complementing group 3 (XRCC3) Thr241Met polymorphism by additive model. Studies are plotted according to the first author’s last name. Horizontal lines represent 95% CI. Each square represents the OR point estimate and its size is proportional to the weight of the study. The diamond (and broken line) represents the overall summary estimate, with confidence interval given by its width. The unbroken vertical line is at the null value (RR = 1.0).
