
Figure 2.
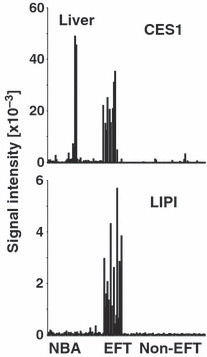
High expression of lipase I (LIPI) and CES1 in Ewing family tumors (EFT) but not in other tumor samples. Presented are signal intensities (Affymetrix HG_U133Plus2.0 microarrays) from normal tissues (NBA), EFT, and other tumor samples (Non‐EFT) for CES1 and LIPI. Whereas LIPI is only detectable in EFT, CES1 is highly expressed in normal liver. See Materials and Methods for a description of NBA and tumor samples.