
Figure 5.
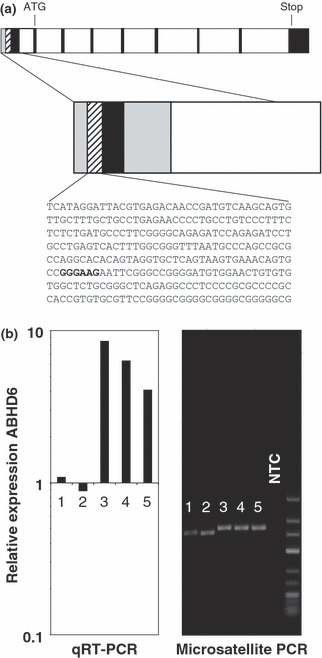
Analysis of putative EWSR1–ETS binding sites upstream of α/β hydrolase domain containing 6 (ABHD6). (a) Analysis of the human ABHD6 locus. Exons are shown as filled boxes, introns as open boxes. The predicted CpG island is shown in gray, the predicted promoter region is shaded. The position of the start codon, stop codon, and probable ETS binding site are indicated. (b) Analysis of ABHD6‐associated GGAA repeats in Ewing family tumor (EFT) cell lines. Length of ABHD6‐associated microsatellites from five EFT cell lines (1, SK‐ES; 2, TC71; 3, A673; 4, SK‐N‐MC; 5, RD‐ES) was visualized by RT‐PCR as described in Materials and Methods (right panel). In parallel, expression of ABHD6 was quantified by quantitative RT‐PCR (qRT‐PCR) in the same cell lines (left panel). For comparative gene expression analysis the signal of one neuroblastoma cell line (not shown) was set as one. NTC, no template control.