
Figure 3.
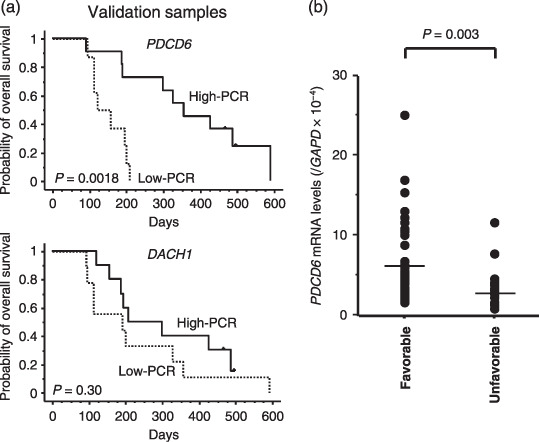
Results of real‐time reverse transcription polymerase chain reaction (RT‐PCR) analysis and patient survival in the independent validation set of 19 samples. (a) The Kaplan–Meier method was used to estimate the overall survival. The low PDCD6 expression groups had significantly poorer outcomes (P = 0.0018). High‐PCR, group with high expression levels as determined by PCR. Low‐PCR, group with low expression levels as determined by PCR. (b) All quantified expression levels of real time RT‐PCR data are shown. The mRNA expressions of PDCD6 were significantly lower in unfavorable group (P = 0.003) and varied ~25 fold (range, 0.98–25.1). Favorable, the patients with survival time over 180 days. Unfavorable, the patients with a survival time less than 180 days.