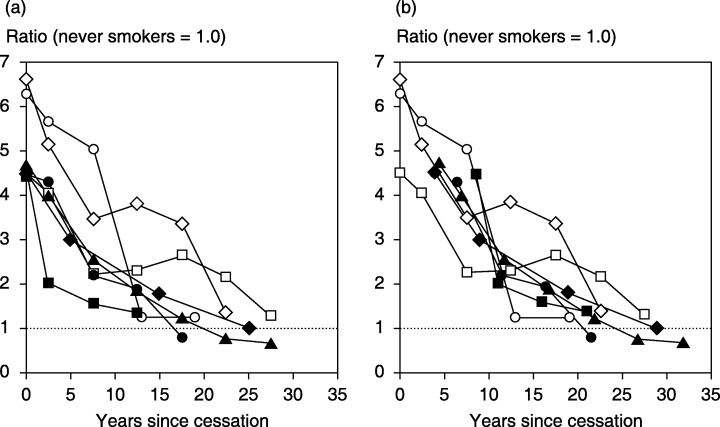
Figure 2.

Decreasing patterns of lung cancer risk in men after quitting smoking in case‐control and cohort studies in Japan (a), and the graph redrawn adding half of the follow‐up period to years since cessation in the cohort studies (b). Odds ratios or mortality/incidence rate ratios compared with never smokers are displayed from published data: ▪, Hirayama;( 3 )◆, Sobue et al. (JPHC Study);( 7 )•, Ando et al. (JACC Study);( 8 )▴, the present study; □, Sobue et al.;( 4 )◊, Gao et al.;( 5 ) and ○, Stellman et al. (the Aichi portion with community controls).( 6 )
