
Figure 3.
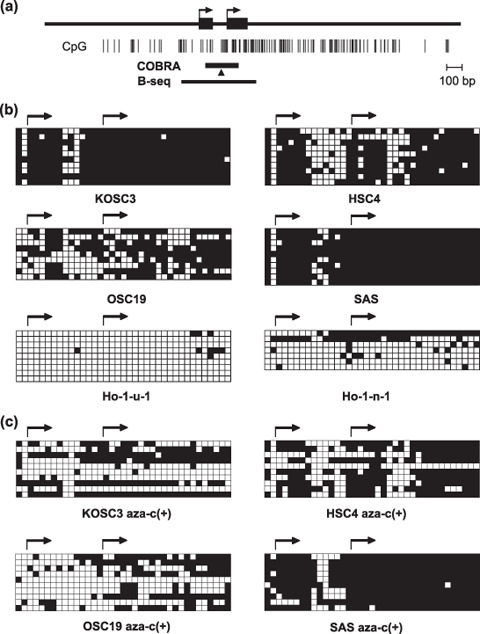
Bisulfite sequencing of RASSF2. (a) Schematic representation of the RASSF2A CpG island. CpG sites are indicated by vertical bars; the region analyzed by combined bisulfite restriction analysis (COBRA) and bisulfite sequencing is indicated by a solid bar. Arrows indicate the transcription start sites. Arrowhead indicates the CpG site analyzed by COBRA. The cell lines studied are shown below the columns. (b) Open squares indicate unmethylated CpG sites; filled squares indicate methylated CpG sites. (c) Demethylation of RASSF2 in OSCC cells treated with 2 µM 5‐aza‐dC for 72 h. The cell lines examined are shown below the column.