
Figure 4.
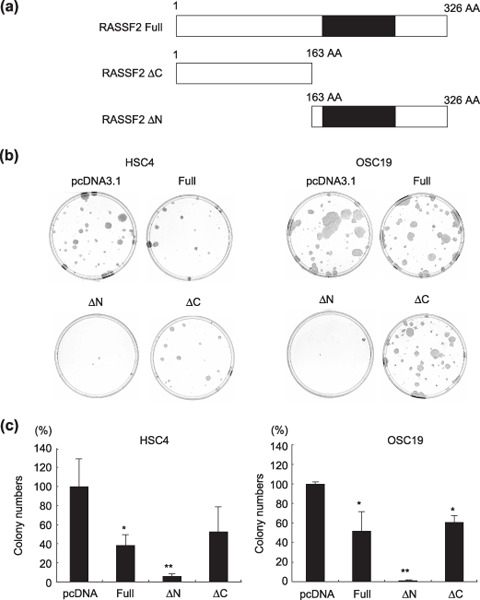
Suppression of cell growth by RASSF2. (a) Schematic diagrams of RASSF2 and the deletion mutants used. (b,c) Suppression of growth evaluated by assaying geneticin‐resistant colony formation. HSC4 and OSC19 cells were transfected with either pCDNA3.1 (control plasmid), RASSF2A, RASSF2‐ΔN, or RASSF2A‐ΔC and incubated with 0.6 mg/mL G418 in the RPMI‐1640 medium. After 14 days, plates were stained with Giemsa solution (b), and the colonies were counted (c). The bars indicate mean ± SD of three independent experiments. *P < 0.05, **P < 0.01 versus vector control (pcDNA).