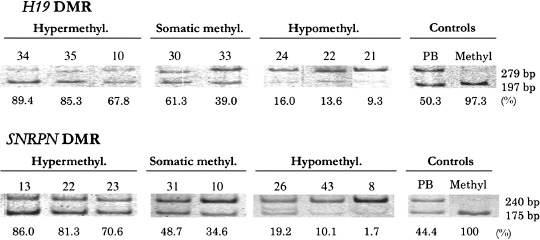
Figure 1.

Examples of the methylation status of the CCCTC‐binding factor binding site 6 (CTCF6) binding site of H19 differential methylated region (DMR) and SNPRN DMR analyzed by a combined bisulfate restriction assay (COBRA). Bisulfate‐modified polymerase chain reaction products were digested with MluI or CfoI. Upper 279 bp and lower 197 bands in the upper lane show unmethylated and methylated fragments containing the CTCF6 binding site, respectively, and upper 240 and lower 175 bands in the lower lane show unmethylated and methylated fragments containing SNPRN DMR, respectively. PB, lymphocyte DNA showing normal somatic methylation; Methyl. control methylated DNA. Numbers above lanes indicate the tumor number. The percentage of methylated DNA calculated from the bands above is shown below each lane. The tumors were classified as hypermethylated (>66.6%), somatically methylated (33.3–66.6%), and hypomethylated (<33.3%).
