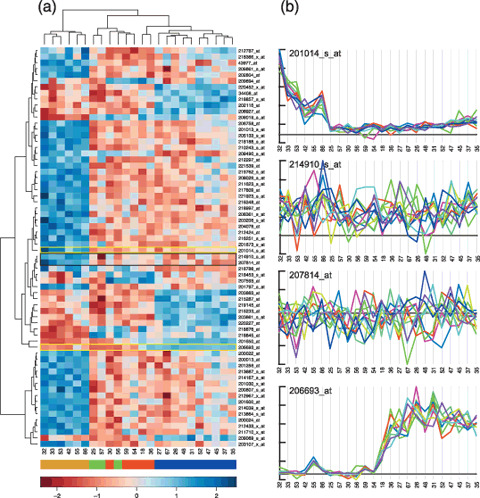
Figure 1.

Heatmaps, clustering, and details. We reanalyzed the Neuroblastoma dataset of McArdle et al.( 8 ) using a Bioconductor( 14 ) to estimate expression levels using the RMA( 15 ) algorithm; to select probe‐sets that distinguish individual subtypes (MNA, 11q‐ and HYPD, using McArdle et al.'s inferred classification) using SAM( 16 ); and finally the heatmap_2 function to display and cluster the expression of the selected genes. (a) The resulting heatmap and dendrograms. Although the heatmap demonstrates that the individual subtypes (with some mixture of GNB and HYPD) can be segregated on the basis of the underlying expression, it also clearly indicates a significant heterogeneity within the individual sample classes. With the exception of the MYCN subtypes, there are few probe‐sets that are specific to individual subtypes and there is much variation in the signals within sample subtypes. However, it is difficult to judge the reliability and the likely biological significance of the changes in expression displayed. On Affymetrix arrays, genes are represented by a set of probe‐pairs (referred to as a probe‐set). Expression values can be calculated from these probe‐sets in a number of ways (eg. RMA used for the heatmap), but it is also possible to simply plot the signals from the individual probe‐pairs across a data series. (b) Plots of the underlying probe‐pair data for the probe‐sets indicated by gold boxes (clean data) and the single black box (messy data). The 214910_s_at (APOM) and 207814_at (DEFA6) probe‐sets were chosen as they form the pair with the smallest distance in the dendrogram, implying some special significance. However, the signals from the individual probe‐pairs of these probe‐sets show little or no covariation across the experimental series, suggesting that the inferred expression estimates are unreliable. In stark contrast the raw probe‐pair data from the 201014_s_at (PAICS) and 206693_at (Il‐7) probe‐sets shows a high degree of internal correlation indicating highly reliable data. In addition the plots show that the levels in the MYCN and 11q‐samples respectively deviate significantly from a baseline that lies close to an estimated zero‐signal, indicating a high (to infinity) fold change. None of these details can be inferred from the heatmap display. The numbers beneath the heatmap and plots indicate the sample identifiers used by McArdle et al.; the colour map immediately below indicates the different subtypes as inferred from the expression data( 8 ) as follows: gold MYCN, green GNB, red HYPD, and blue 11q‐. The units of the scale bar at the bottom are in SD (expression values are normalized across the rows of the heatmap to have a mean of 0 and a variance of 1).
