
Figure 1.
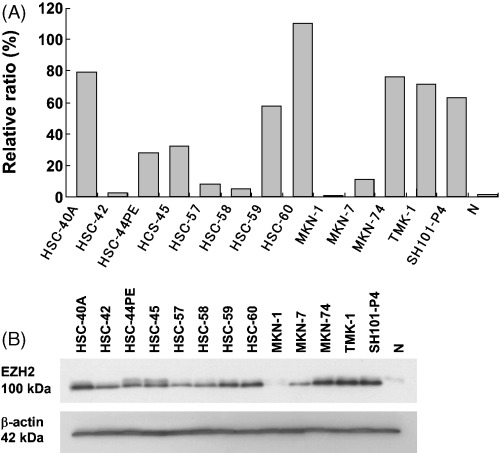
Expression of enhancer of zeste homolog 2 (EZH2) in 13 human gastric cancer cell lines. (A) Expression levels of EZH2 mRNA were quantitatively verified by real‐time reverse transcription‐polymerase chain reaction (RT‐PCR). The correction values of EZH2 expression were calculated by dividing the EZH2 amounts by the amount of internal control (β‐actin) concurrently examined on the same samples. (B) Expression levels of EZH2 protein by western blot analysis. Single 100 kDa band was detected in all cell lines. β‐actin was used as internal control for equal loading. N, non‐cancerous gastric mucosa.