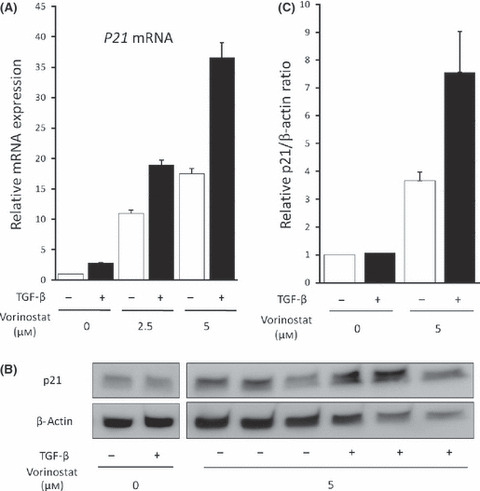
Figure 5.

(A) p21 mRNA induction in Mz‐ChA‐2 cells by 0–5 μM vorinostat for 48 h with or without 5 ng/mL TGF‐β1 was measured by real‐time PCR. (B) p21 protein expression in Mz‐ChA‐2 cells induced by 0 or 5 μM vorinostat for 48 h with or without 5 ng/mL TGF‐β1 was detected by Western blot. (C) Relative densitometric ratios of p21 and β‐actin are also shown. The data are expressed as means ± SD of three independent experiments.
