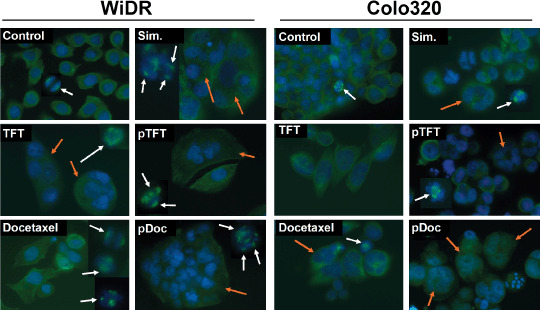
Figure 6.

Representative immunofluorescence stainings of α‐tubulin (mitotic spindle; green; white arrows) and Hoechst (DNA, blue; polynucleated cells, orange arrows) (n = 4). Cells were exposed to trifluorothymidine (TFT), docetaxel, simultaneous combination (Sim), preincubation with TFT (pTFT), or a preincubation with docetaxel (pDoc) for 72 h.
