
Figure 1.
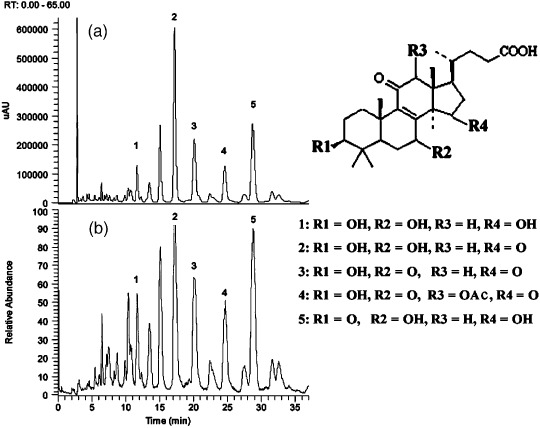
High performance liquid chromatography – diode array detector – electrospray ionization –mass spectrometry (HPLC‐DAD‐ESI‐MS) analysis of Ganoderma triterpenes. (a) High‐performance liquid chromatography‐ultraviolet chromatogram monitored at 252 nm. (b) Liquid chromatography (LC)‐negative ion ESI‐MS total ion current profile. The chemical structures of the compounds corresponding to peaks 1–5 are also shown.