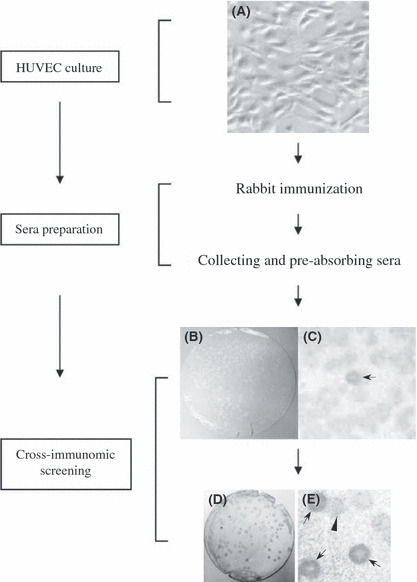
Figure 1.

Diagrams represent the flowchart of CR‐SEREX (cross‐reactive serological expression cloning) strategy. (A) Human umbilical vein endothelial cells (HUVEC); (B–E) CR‐SEREX screening results, positive clones were indicated by arrows, the negative clone was indicated by arrowhead; (B) first cycle screening results; (D) second cycle screening results; (C,E) the larger view of (B) and (D).
