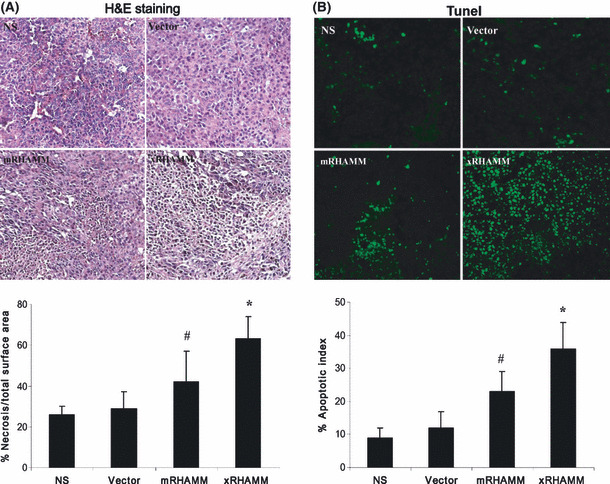
Figure 3.

Pathological analyses of tumor tissues. (A) Fixed sections of tumors were stained with H&E. The surface area of necrotic tissue relative to total surface area of the field of view was quantified by morphometric analysis. (B) Apoptosis in xenograft tumors was determined by TUNEL analysis. SDs are indicated by error bars. #P < 0.05, *P < 0.01. NS, normal saline.
