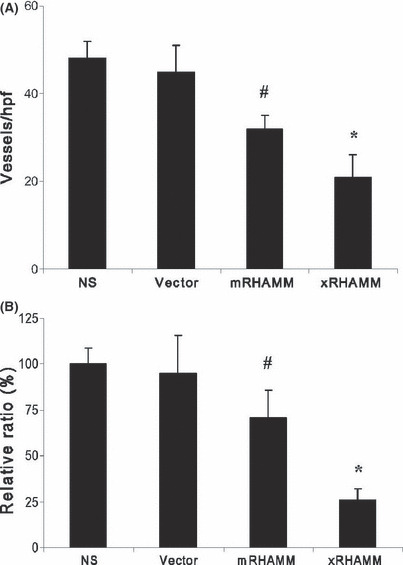
Figure 5.

(A) Vessels were stained with CD31 antibody and vessel density was determined by counting the number of the microvessels per high‐power field. (B) In vivo evaluation of anti‐angiogenesis using the sponge model was quantified by measuring the colorimetric change. SDs are indicated by error bars. #P < 0.05, *P < 0.01. NS, normal saline.
