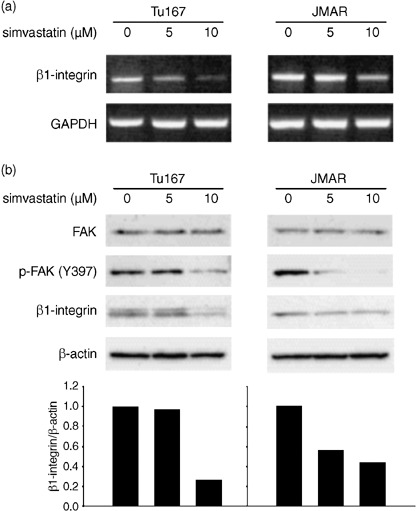
Figure 6.

(a) Effect of simvastatin on expressions of β1‐integrin mRNA transcript and protein. Analysis of β1‐integrin mRNA expression using reverse transcription‐polymerase chain reaction (RT‐PCR). Head and neck squamous cell carcinoma cells were incubated for 48 h with 5 or 10 µM simvastatin and compared with untreated cells (incubated with vehicle). (b) Analysis of β1‐integrin, FAK, and p‐FAK (Y397) expressions using western blot. The condition of cell culture was identical with that of RT‐PCR analysis. The intensity of each band of western blot was determined using NIH Image program and the ratio of β1‐integrin and β‐actin was calculated for each treatment. The β1‐integrin/β‐actin ratio in untreated cells was set as 1. GAPDH, glyceraldehyde‐3‐phosphate dehydrogenase.
