
Figure 4.
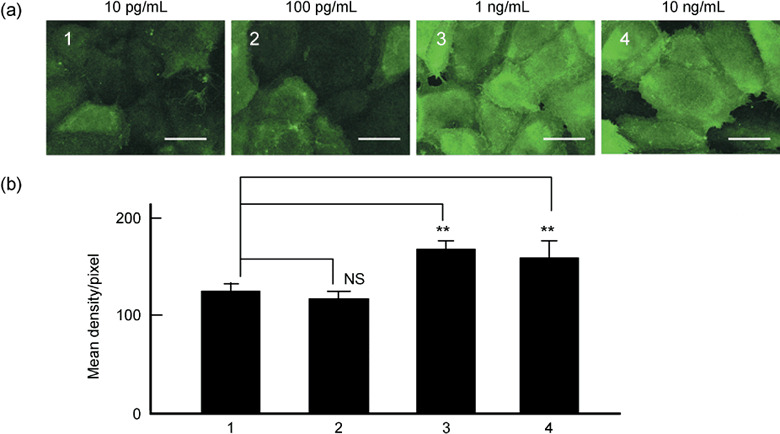
Effects of the concentration of CCL2 ranging from 10 pg/mL to 10 ng/mL on immunohistochemical expression of ICAM‐1 on human LECs. (a) Representative photomicrographs of the effects of 10 pg/mL,( 1 ) 100 pg/mL,( 2 ) 1 ng/mL( 3 ) and 10 ng/mL( 4 ) CCL2 for 18 h of stimulation of the expression of ICAM‐1 on the human LECs. Each marker is 50 µm. (b) Summarized density measurement data of each photomicrograph using Scion image analysis. The number of the abscissa coincides with each one shown in (a). The ordinate denotes the normalized value of the density measurement shown by mean density/pixel (n = 5). NS, not significant. **P < 0.01, significantly different from the value obtained with 10 pg/mL CCL2.