
Figure 2.
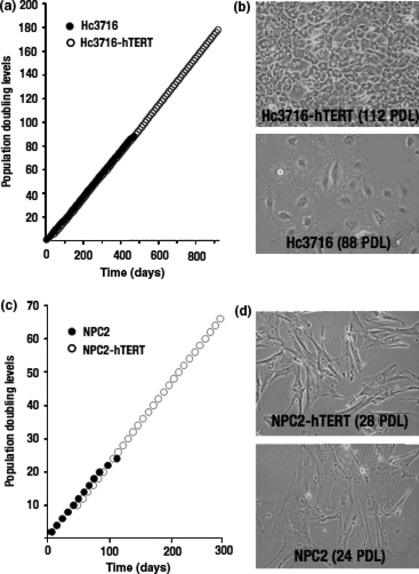
Morphology and growth curve of parental cells and human telomerase reverse transcriptase (hTERT)‐infected cells. (a) Cumulative growth curve in Hc3716 human fetal hepatocytes and Hc3716‐hTERT. (b) Morphology of Hc3716 [88 population doubling levels (PDL); senescent state] and Hc3716‐hTERT (112 PDL). (c) Cumulative growth curve in normal non‐parenchymal cells (NPC2) and NPC2‐hTERT. (d) Morphology of NPC2 (24 PDL; senescent state) and NPC2‐hTERT (28 PDL).