
Figure 2.
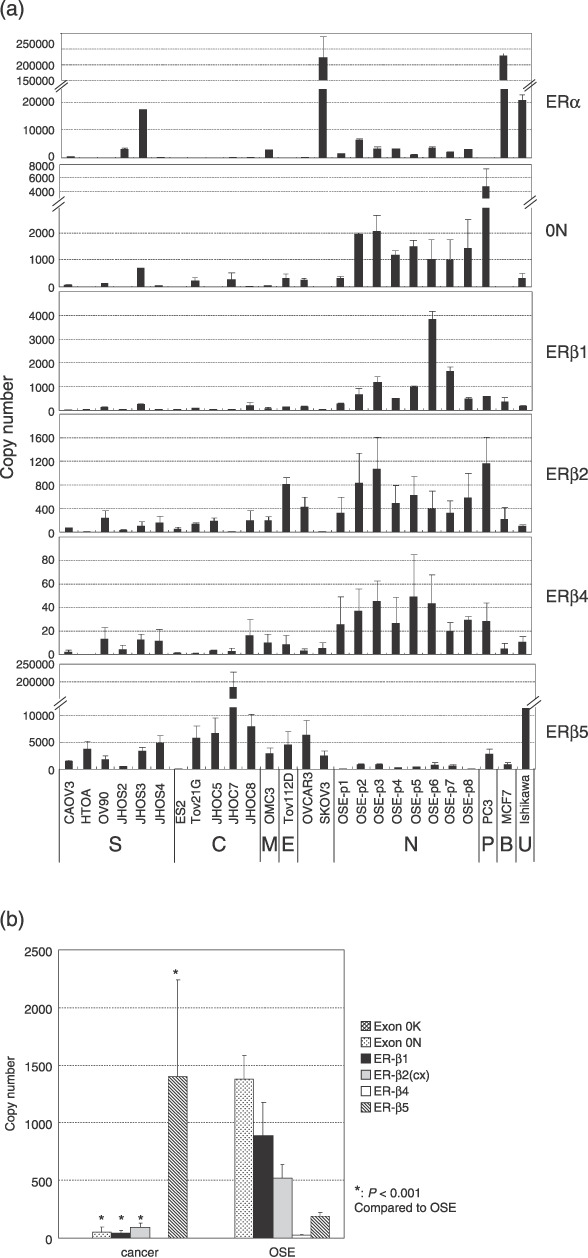
Expression of estrogen receptor (ER)‐β isoform mRNA in ovarian cancer cell lines, normal ovarian surface epithelial cells in primary culture (OSE), PC3, MCF3, and Ishikawa cells. (a) Each bar is the mean ± SD of two independent quantitative real‐time reverse transcription–polymerase chain reaction experiments, standardized against an internal positive control (glyceraldehyde 3‐phosphate dehydrogenase). The capital letters at the bottom of the figure refer to the origin of the cell lines (B, breast carcinoma; C, clear cell adenocarcinoma; E, endometrioid adenocarcinoma; M, mucinous adenocarcinoma; N, normal ovarian surface epithelial cells; P, prostatic carcinoma; S, serous adenocarcinoma; U, uterine carcinoma). Summary of the expression levels of ERβ isoform mRNA in ovarian cancer cell lines and OSE. (b) Each bar is the median ± SE of the expression levels of ERβ isoforms as shown in (a). Asterisks denote significant differences compared with OSE.