
Figure 7.
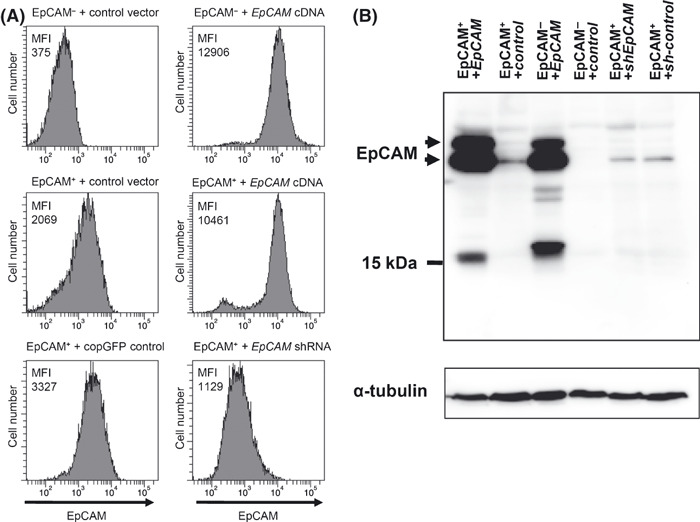
Overexpression and knockdown of epithelial cell adhesion molecule (EpCAM) in cell clones. (A) Surface expression of EpCAM in clones with genetic modifications. Cells were stained with an anti‐EpCAM mAb and subjected to FACS analysis. Upper panel: an EpCAM− clone infected with control (left) or EpCAM‐coding lentivirus (right). Central panel: an EpCAM+ clone infected with control (left) or EpCAM‐coding lentivirus (right). Bottom panel: an EpCAM+ clone infected with control virus (left) or lentivirus expressing a shRNA for EpCAM knockdown (right). Each panel shows the expression of EpCAM. The number shown in each panel represents the mean fluorescent intensity (MFI) of the EpCAM staining. (B) Expression of EpCAM protein in each cell line. Immunoblotting was carried out with an anti‐EpCAM antibody that recognizes the intracellular domain of EpCAM and anti‐α‐tubulin. The bands around 15 kDa are probably non‐specific, because the intracellular domain of EpCAM has a molecular weight of 5 kDa.( 44 ) The data represent at least three independent experiments.