
Figure 5.
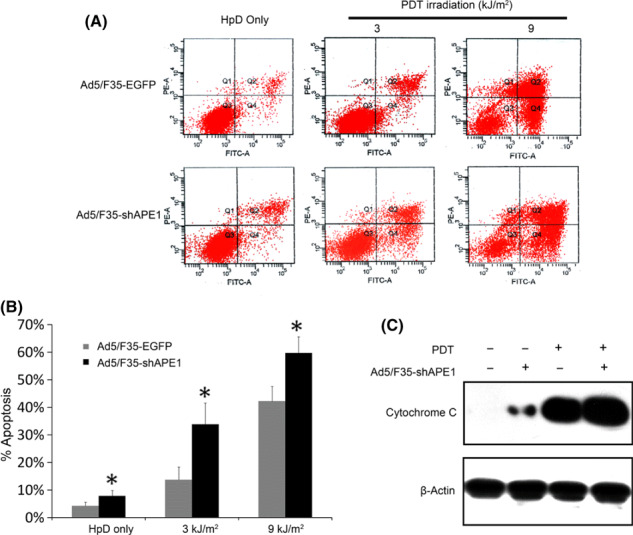
Knock down of apurinic/apyrimidinic endonuclease (APE) 1 by Ad5/F35‐shAPE1 promoted photodynamic therapy (PDT)‐induced apoptosis of A549 cells in a mitochondria‐dependent way. (A) Dot plot of the apoptotic assay of the Ad5/F35‐shAPE1 group at 6 h after PDT irradiation, with the Ad5/F35‐EGFP group as a negative control. The x‐axis is Annexin‐V–Pacific Blue and the y‐axis is 7‐aminoactinomycin D (7‐AAD) for all graphs represented. The cells undergoing early apoptosis are Annexin‐V‐positive and 7‐AAD‐negative in the lower right quadrants. (B) The apoptotic cell percentages of each group are shown in a graphic pattern. After photodynamic irradiation, there were significantly more cells undergoing apoptosis in the Ad5/F35‐shAPE1 group than in the Ad5/F35‐EGFP group. The cytoplasmic fractions were subjected to immunoblotting with anti‐cytochrome c antibody, and the anti‐β‐actin antibody was used as a cytoplasmic fraction loading control. (C) In the Ad5/F35‐shAPE1 group the mitochondria‐excluded cytoplasmic fraction contained more cytochrome c before or 6 h after PDT irradiation compared with the Ad5/F35‐EGFP group. *The apoptotic cell percentage differed significantly from Ad5/F35‐EGFP controls (P <0.05).