
Figure 2.
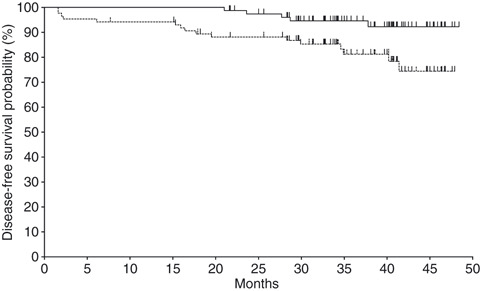
Kaplan–Meier plot for disease‐free survival (dashed line) and overall survival (solid line) in all randomized patients (n = 86).
Official websites use .gov
A
.gov website belongs to an official
government organization in the United States.
Secure .gov websites use HTTPS
A lock (
) or https:// means you've safely
connected to the .gov website. Share sensitive
information only on official, secure websites.
Kaplan–Meier plot for disease‐free survival (dashed line) and overall survival (solid line) in all randomized patients (n = 86).