
Figure 2.
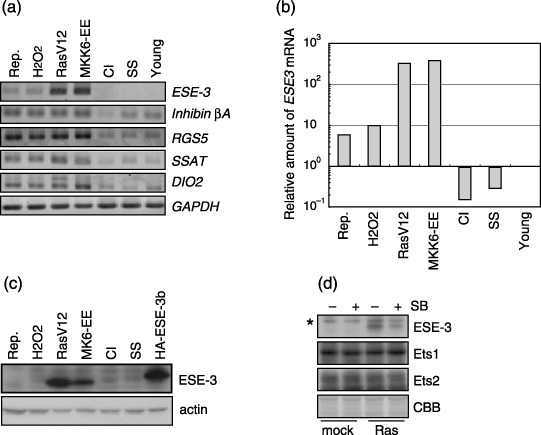
ESE‐3 expression is up‐regulated in senescent cells but not in quiescent cells. (a) Expression levels of ESE‐3 were measured using RT‐PCR in WI‐38 cells exhibiting the following conditions. CI, contact inhibition; H2O2, H2O2‐induced senescence; MKK6‐EE, MKK6‐EE‐induced senescence; RasV12, Ras‐induced senescence; Rep., replicative senescence; SS, serum starvation; Young, actively growing young cells. (b) Quantitative analyses of ESE‐3 mRNA levels as revealed by real‐time PCR. The value obtained for the young cells was set at 1. (c) ESE‐3 proteins as revealed by immunoblotting analyses using 5A5.5. WI‐38 cells retrovirally expressing HA‐ESE‐3b protein were similarly analyzed as control. (d) ESE‐3, Ets1 and Ets2 protein levels as revealed by immunoblotting analyses in mock and RasV12‐expressing cells with or without SB203580 treatment. The band that appears in all lanes (asterisk) is a non‐specific signal. Coomassie Brilliant Blue (CBB) staining indicates that an equal amount of the total protein was loaded in each lane (representative parts of staining where ESE‐3 migrated are shown).