
Figure 3.
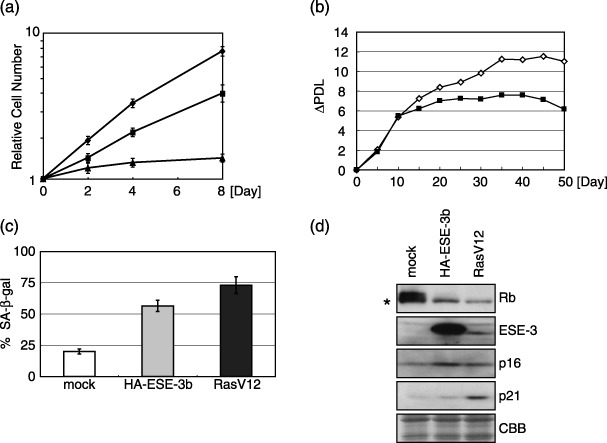
Ectopic expression of ESE‐3b induces cellular senescence phenotypes in WI‐38 cells. (a) Growth curves of HA‐ESE‐3b‐expressing (squares), RasV12‐expressing (triangles) and mock‐infected (diamonds) cells. (b) Increases of population doublings for mock (open diamonds) and HA‐ESE‐3b‐expressing (filled squares) WI‐38 cells. Cells were cultured by feeding medium at intervals. Increases of population doublings after day 6 were calculated and indicated in the vertical axis. (c) Percentages of SA‐β‐gal‐positive cells for mock (white column), HA‐ESE‐3b‐expressing (gray) and RasV12‐expressing (dark gray) WI‐38 cells at day 6. (d) Rb, ESE‐3, p16 and p21 proteins as revealed by immunoblotting analyses in mock, HA‐ESE‐3b‐ and RasV12‐expressing cells at day 6. Hypo‐phosphorylated Rb is indicated by an asterisk. The migration of ESE‐3b in HA‐ESE‐3b‐expressing cells is slower than that in RasV12‐expressing cells due to the presence of an HA tag.