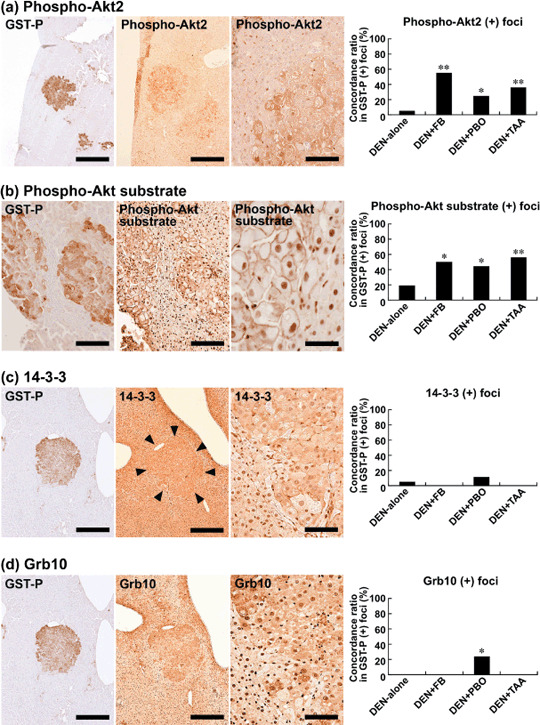
Figure 2.

Immunohistochemical localization of phospho‐protein kinase B 2 (Akt2), phospho‐Akt substrate, 14‐3‐3, and Grb10 (growth factor receptor bound protein 10) in glutathione S‐transferase placental form (GST‐P)‐positive liver cell foci after promotion for 6 weeks. (a) Phospho‐Akt2 expression (middle and right) in a GST‐P‐positive focus (left) in the liver of a rat promoted with 3600 p.p.m. fenbendazole (FB) after N‐diethylnitrosamine (DEN) initiation. Note the mostly cytoplasmic expression with scattered nuclear immunoreactivity of phospho‐Akt2. Bar = 500 µm (left and middle), 100 µm (right). The graph shows concordance ratios (%) of phospho‐Akt2 immunoreactivity with GST‐P‐positive foci generated after promotion with FB, piperonyl butoxide (PBO), or thioacetamide (TAA). *, **: P < 0.05, 0.01 versus DEN‐alone group (χ2‐test). (b) Immunoreactivity against antiphospho‐Akt substrate antibody (middle and right) in a GST‐P‐positive focus (left) in the liver of a rat promoted with 400 p.p.m. TAA after DEN initiation. Note the predominant membrane immunoreactivity of phospho‐Akt substrate. Bar = 100 µm (left and middle), 50 µm (right). The graph shows concordance ratios (%) of phospho‐Akt substrate immunoreactivity with GST‐P‐positive foci generated after promotion with FB, PBO, or TAA. *, **: P < 0.05, 0.01 versus DEN‐alone group (χ2‐test). (c) 14‐3‐3 expression (middle and right) in a GST‐P‐positive focus (left) in the liver of a rat promoted with 20 000 p.p.m. PBO after DEN initiation. Margin of the focus expressing 14‐3‐3 is marked with arrowheads (middle). Note both of the nuclear and cytoplasmic immunoreactivities of 14‐3‐3. Bar = 500 µm (left and middle), 100 µm (right). The graph shows concordance ratios (%) of 14‐3‐3 immunoreactivity with GST‐P‐positive foci generated after promotion with FB, PBO, or TAA. (d) Grb10 expression (middle and right) in a GST‐P‐positive focus (left) in the liver of a rat promoted with 20 000 p.p.m. PBO after DEN initiation. The same focus expressing 14‐3‐3 as shown in panel (c) is presented. Note both of the nuclear and cytoplasmic immunoreactivities of Grb10. Bar = 500 µm (left and middle), 100 µm (right). The graph shows concordance ratios (%) of Grb10 immunoreactivity with GST‐P‐positive foci generated after promotion with FB, PBO, or TAA. *: P < 0.05 versus DEN‐alone group (χ2‐test).
