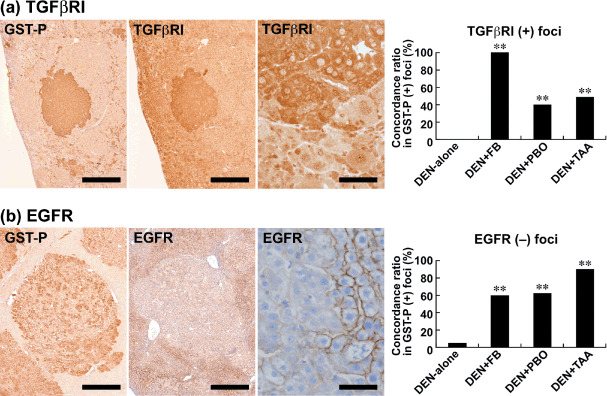
Figure 4.

Immunohistochemical localization of transforming growth factor‐β receptor I (TGFβRI) and epidermal growth factor receptor (EGFR) in glutathione S‐transferase placental form (GST‐P)‐positive liver cell foci after promotion for 6 weeks. (a) TGFβRI expression (middle and right) in a GST‐P‐positive focus (left) in the liver of a rat promoted with 3600 p.p.m. fenbendazole (FB) after N‐diethylnitrosamine (DEN) initiation. Note the mostly cytoplasmic expression of TGFβRI. Bar = 500 µm (left and middle), 50 µm (right). The graph shows the concordance ratios (%) of TGFβRI immunoreactivity with GST‐P‐positive foci generated after promotion with FB, piperonyl butoxide (PBO), or thioacetamide (TAA). **: P < 0.01 versus DEN‐alone group (χ2‐test). (b) Lack of EGFR expression (middle and right) in a GST‐P‐positive focus (left) in the liver of a rat promoted with 3600 p.p.m. FB after DEN initiation. Bar = 500 µm (left and middle), 50 µm (right). The graph shows the concordance ratios (%) of EGFR negativity with GST‐P‐positive foci generated after promotion with FB, PBO, or TAA. **: P < 0.01 versus DEN‐alone group (χ2‐test).
