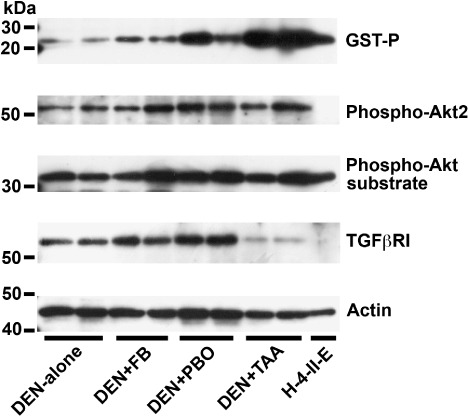
Figure 5.

Polypeptide signal levels of glutathione S‐transferase placental form (GST‐P), phospho‐protein kinase B 2 (Akt2), phospho‐Akt substrate, and transforming growth factor‐β receptor I (TGFβRI) in the liver tissues after promotion for 6 weeks (N = 2/group). Blotted membranes were prepared for signal detection of each antigen and reprobed with actin as a control for sample loading. Cell lysate of a rat hepatoma cell line that is known to express GST‐P, H‐4‐II‐E, was also included in the analysis. As compared with N‐diethylnitrosamine (DEN)‐alone group, mean relative values of band intensity of GST‐P are 1.7 by promotion with fenbendazole (FB), 5.8 with piperonyl butoxide (PBO), and 13.8 with thioacetamide (TAA). With regard to phospho‐Akt2, relative values as compared with DEN‐alone group are 1.4 by promotion with FB, 2.0 with PBO, and 1.7 with TAA. With regard to phospho‐Akt substrate, a single band migrating approximately 32 kDa could be detected in all groups, and relative values to DEN‐alone group are 1.3 by promotion with FB, 1.5 with PBO, and 1.3 with TAA. Relative levels of TGFβRI signal as compared to DEN‐alone group are 1.5 by promotion with FB, 2.2 with PBO, and 0.2 with TAA. Relative levels of actin signal to the DEN‐alone group as represented by the samples examined for TGFβRI expression shown here are 0.8 by promotion with FB, 1.1 with PBO, and 0.7 with TAA.
