Figure 2.

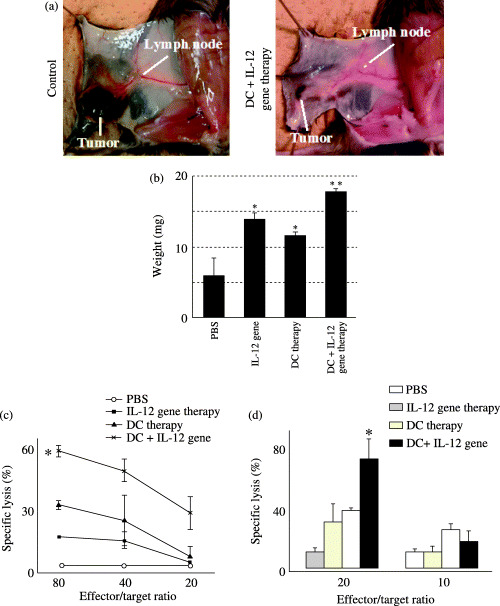
Changes in draining lymph nodes after treatment. (a) Lymphadenopathy was observed after treatment. (b) Mean weight of the lymph nodes in each group is shown. *P < 0.05 versus PBS; **P < 0.05 versus other protocols. (c) To obtain effector cells, 2 × 10⁶ cells derived from regional lymph nodes were restimulated in vitro with 2 × 10⁵ mitomycin C‐treated B16F10 cells in the presence of recombinant murine IL‐2 (25 IU/mL) for 5 days. Lymphoid cells were harvested and washed three times in serum‐free medium and applied as effectors. Cytolytic activity was assessed against B16F10 cells at various effector/target ratios from mice treated with DC alone, IL‐12 gene therapy alone, or DC and IL‐12 gene therapy in combination. Data are presented as mean ± SD cytotoxicity of effector cells obtained from draining lymph nodes. *P < 0.05 versus other protocols. (d) Cytolytic activity was assessed against YAC‐1 cells at effector/target ratios of 10 and 20 from mice treated with DC alone, IL‐12 gene therapy alone or DC and IL‐12 gene therapy in combination. Data are presented as mean ± SD cytotoxicity of effector cells obtained from draining lymph nodes. *P < 0.05 versus other protocols.
