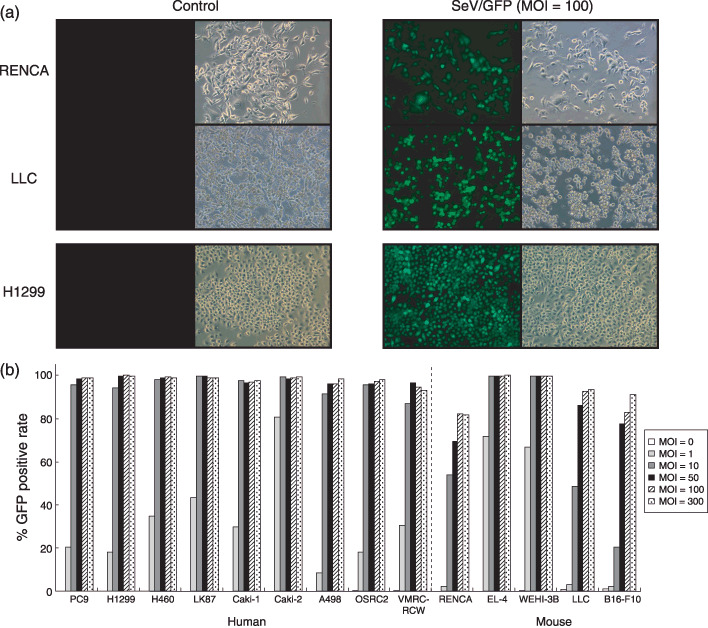
Figure 2.

Transduction of various mouse and human cell lines with the SeV/dF/GFP vector. (a) RENCA (row 1), Lewis lung carcinoma (LLC) (row 2), and H1299 cells (row 3) were transduced with SeV/dF/GFP at a multiplicity of infection (MOI) of 100. Fluorescence microscopy of transduced cells was carried out 48 h later (green fluorescent protein [GFP] phases are displayed in column 3). The background fluorescence of transduced cells (control; column 1) was determined in non‐transduced cultures. Phase contrast pictograms are displayed in columns 2 and 4. (b) Nine mouse and five human cell lines were transduced with SeV/dF/GFP at MOI of 0, 1, 10, 50, 100, and 300. The percentage of GFP‐expressing cells was determined by flow cytometric analysis. The bar graph depicts the percentage of GFP‐positive cells at 48 h after transduction with or without SeV/dF/GFP.
