
Figure 2.
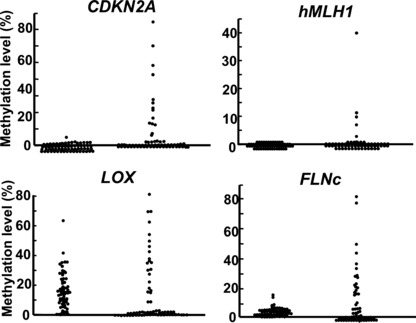
Distribution patterns of methylation in non‐cancerous and cancer tissues. Methylation levels, which reflect fractions of cells with the methylation, were quantified in 66 paired samples of non‐cancerous and cancer tissues of gastric cancer patients (modified from Enomoto et al. ( 39 )). They showed a unimodal distribution in non‐cancerous tissues, and a “bimodal” distribution, namely zero or positive, in cancer tissues. This finding supports the idea that methylation in a non‐cancerous tissue reflects events in many cells in the tissue whereas that in a cancer tissue mostly reflects only events in its single precursor cell.