
Figure 1.
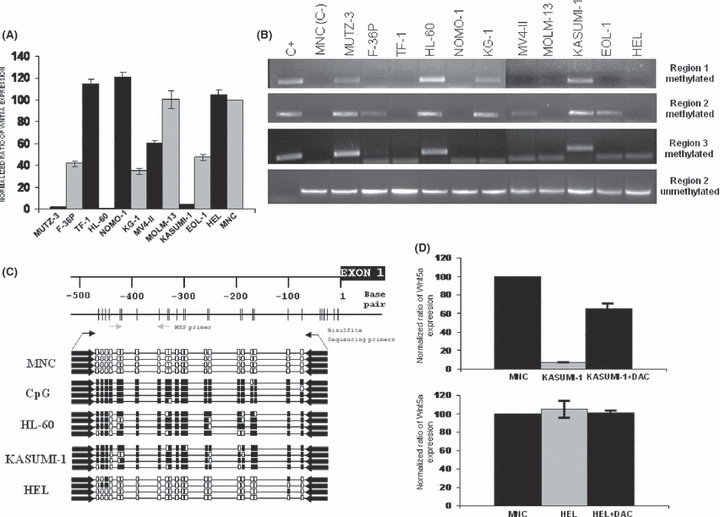
Expression and methylation analysis of the WNT5A gene in acute myeloid leukemia (AML)‐derived cell lines. (A) Quantitative real‐time PCR expression of WNT5A in AML‐derived cell lines demonstrating downregulation of gene expression in seven of the 11 cell lines studied. Gene expression was normalized using the expression in bone marrow mononuclear cells (BM‐MNC) from 30 healthy controls (normalized ratio = 100%). The figure represents the mean of three different studies in triplicate. (B) Methylation‐specific PCR (MSP) analysis of WNT5A in the same AML‐derived cell lines. Region 2 of WNT5A was methylated in all of the cell lines that had downregulated WNT5A expression. C+, positive methylated control; C–, BM‐MNC cells from healthy donors. (C) Schematic description of the WNT5A CpG island region 2. Each vertical bar represents a CpG dinucleotide. The gray arrows show the location of the MSP primers and the black arrows the location of bisulfite sequencing primers. The figure also represents the analysis of WNT5A CpG island methylation status by bisulfite sequencing in AML‐derived cell lines. Each box indicates a CpG dinucleotide (white box, unmethylated; black box, methylated) and each line represents the analysis of 21 CpG dinucleotides of a single clone of the WNT5A analysed region. (D) Expression analysis of the Wnt5a gene in the methylated KASUMI‐1 cell line and in the unmethylated HEL cell line, before and after treatment with the demethylating agent 5‐Aza‐2′‐deoxycytidine (DAC) demostrating upregulation of the gene after treatment in AML‐derived cell line that was methylated. Gene expression was normalized with expression in BM‐MNC from healthy controls (normalized ratio = 100%). The figure represents the mean of three different studies in triplicate.