
Figure 3.
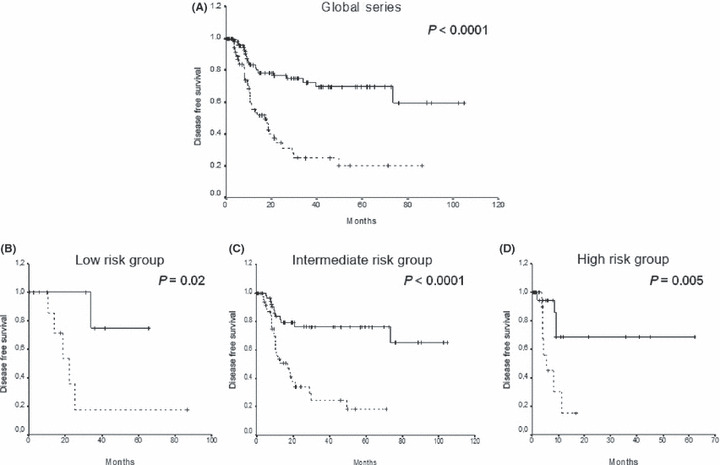
Kaplan–Meier disease‐free survival (DFS) function for acute myeloid leukemia (AML) patients. DFS curves for (A) all of the patients included in this study, and for patients classified into cytogenetic (B) low‐risk, (C) intermediate‐risk, and (D) high‐risk groups according to the WNT5A methylation status. Solid lines, WNT5A unmethylated patients. Dashed lines, WNT5A methylated patients.