Figure 5.

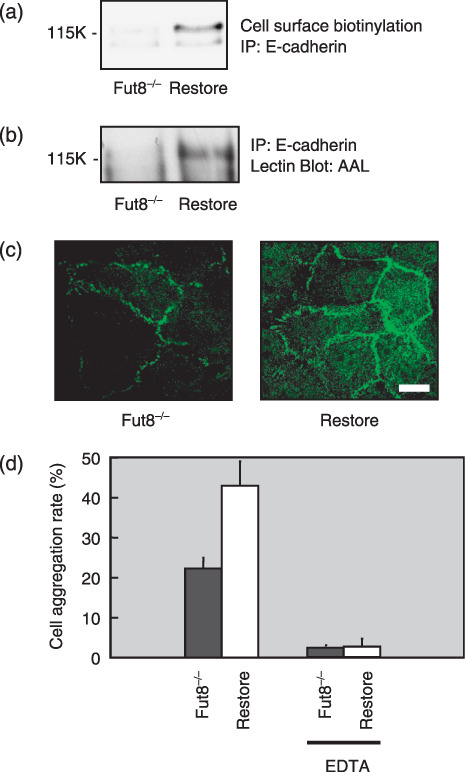
Changes of E‐cadherin expression and E‐cadherin‐dependent cell–cell adhesion in α1,6‐fucosyltransferase (Fut8)−/– cells. (a) Cell surface expression of E‐cadherin in the Fut8−/– mouse kidney epithelial cells and Fut8 restored cells. E‐cadherin was immunoprecipitated from whole cell lysate of surface biotinylated Fut8−/– cells and Fut8 restored cells, and subjected to 8% sodium dodecyl sulfate–polyacrylamide gel electrophoresis (SDS‐PAGE), transferred to nitrocellulose membranes and the biotinylated E‐cadherin were visualized using a Vectastain ABC kit and an enhanced chemiluminescence kit. (b) Lectin blot analysis of E‐cadherin in the Fut8−/– cells and Fut8 restored cells. E‐cadherin was immunoprecipitated from 400 µg of whole cell lysates, subjected to 8% SDS‐PAGE and transferred to nitrocellulose membranes, which were probed by Aleuria aurantia lectin (AAL). (c) Distribution of E‐cadherin on Fut8−/– cells and Fut8 restored cells. E‐cadherin was detected by a laser scanning confocal microscopy using an anti‐E‐cadherin antibody, ECCD‐2. Fut8−/–, Fut8−/– mouse kidney epithelial cells; Restore, Fut8 restored Fut8−/– cells (scale bar, 10 µm). (d) Cell–cell aggregation was assayed with or without EDTA. Data represent the mean (±SD) of six experiments. IP, immunoprecipitation.
