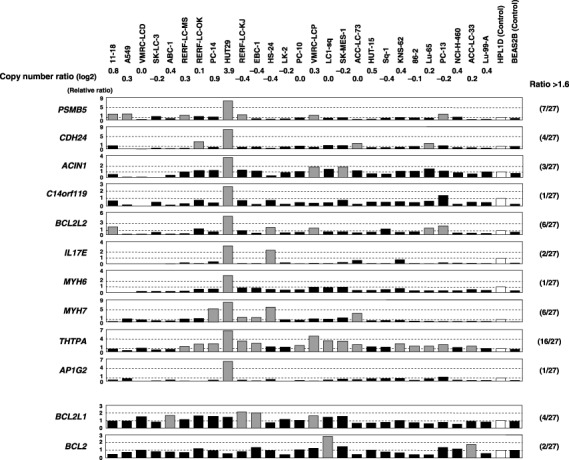
Figure 2.

Expression levels of the 10 candidate target genes within the 14q11.2 amplicon (upper) and prosurvival members of the BCL2 family (lower) in 27 non‐small cell lung cancer (NSCLC) cell lines and immortalized lung epithelial cell lines detected by semiquantitative reverse transcription–polymerase chain reaction (RT‐PCR). RT‐PCR products were electrophoresed on 3% agarose gel, and band quantification was carried out. The mRNA expression of each gene in each sample was normalized on the basis of the corresponding glyceraldehyde‐3‐phosphate dehydrogenase (GAPDH) level. Results were then normalized to the expression level of the gene in the control cell line HPL1D as a normal counterpart, and were recorded as a relative expression level (relative ratio). Expression levels were considered ‘overexpression’ (gray columns) when the expression level of each gene in each sample relative to that in the control cell line HPL1D (open columns) was increased >1.6‐fold. The frequency of overexpression of each gene in the NSCLC cell lines is indicated in parentheses. Relatively frequent (>5 of 27 cell lines) overexpression in NSCLC cell lines was observed for four genes including BCL2L2. Copy number ratio (log2 ratio) at 14q11.2 (BAC RP11‐68M15) was determined in our previous array‐comparative genomic hybridization (CGH) analysis.( 12 )
