
Figure 2.
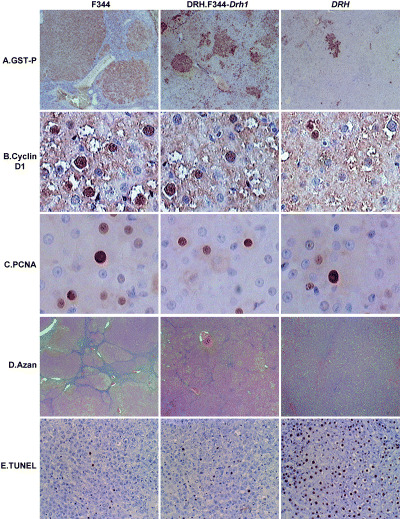
Histochemical analysis of the livers after 8 weeks of administration of 3′‐DAB. (a) GST‐P (×40), (b) Cyclin D1 (×200), (c) PCNA (×200), (d) Azan stain to show fibrosis (×20), (e) TUNEL stain (×40). See Table 1 for quantitative analysis data by image analyzer.