
Figure 4.
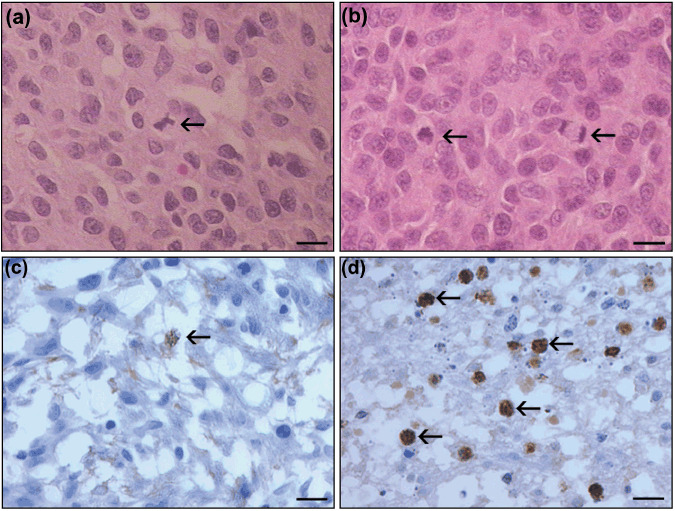
NTPDase2 expression increases C6 glioma proliferation in vivo. In vivo glioma proliferation was assessed by histological analysis of (a,b) HE staining and (c,d) immunohistochemical analysis of Ki67‐positive glioma cell nuclei. (a,c) C6‐EYPF glioma; (b,d) C6‐EYFP/NTPDase2 glioma. Arrows indicate mitotic cells. (d) C6‐EYFP‐NTPDase2 gliomas exhibit an increased number of Ki67‐positive cells when compared to (c) C6‐EYFP‐derived gliomas. The mitotic index analysis is presented in Table 1. Scale bars = 10 µm.