
Figure 2.
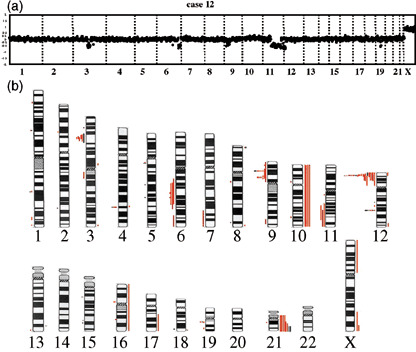
Summary of chromosomal imbalances. (a) A representative array‐comparative genomic hybridization (CGH) profile of patient samples (case 12) is presented. Detected were loss of 3q11.2‐q13.13, 6q22.1, 6q25‐qter, 9p13.3, 9p21.3, 9p23, 11q14.1‐qter, 12p11.22‐p13.2, 12q21.33 and 19q13.11‐q13.12. (b) Chromosomal imbalances detected in all patient samples (red lines) and two cell lines (black lines) are presented. Regions of loss and gain are represented by vertical lines, on the left (loss) and right (gain) side of each ideogram.