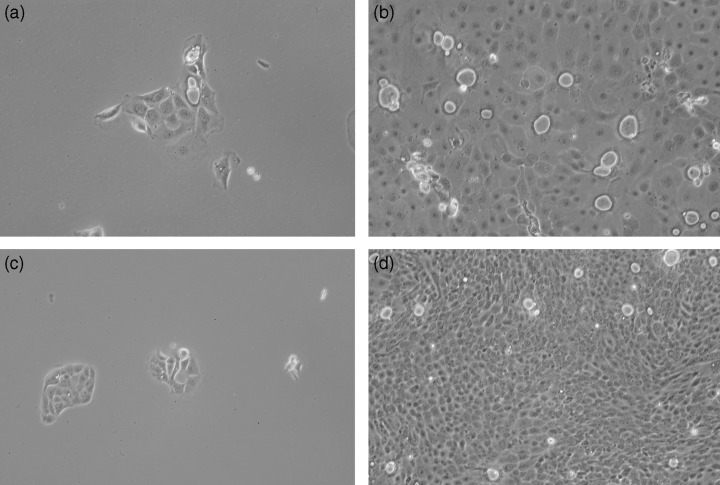
Figure 2.

(a) MGC1 cells derived after single‐cell dilution cloning. MGC1 cells show large cytoplasm with a high nucleus/cytoplasm ratio. (× 80). (b) MGC1 cells at confluence show a monolayer sheet of polygonal‐shaped epithelial cells. (× 80). (c) MGC2 cells derived after single‐cell dilution cloning. They reveal rather small cytoplasm and a much higher nucleus/cytoplasm ratio. (× 80). (d) MGC2 cells at confluence with small cytoplasm and higher growth activity. (× 80).
