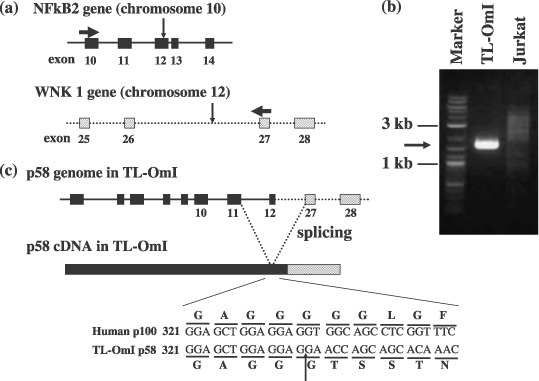
Figure 3.

Genomic and cDNA structures of NF‐κB2/p58 in TL‐OmI. (a) Horizontal and vertical arrows indicate the positions of the primer sequences to amplify genomic NF‐κB2 DNA and the chromosomal breakpoints, respectively. (b) Genomic DNA was extracted from TL‐OmI and Jurkat cells, and NF‐κB2 gene was amplified by polymerase chain reaction. The specific amplification from TL‐OmI is indicated by an arrow. (c) The expected genomic DNA and cDNA structures of NF‐κB2/p58 in TL‐OmI are shown. The nucleotide and amino acid sequences encompassing the boundary region between p100 and WNK1 in p58 are shown.
