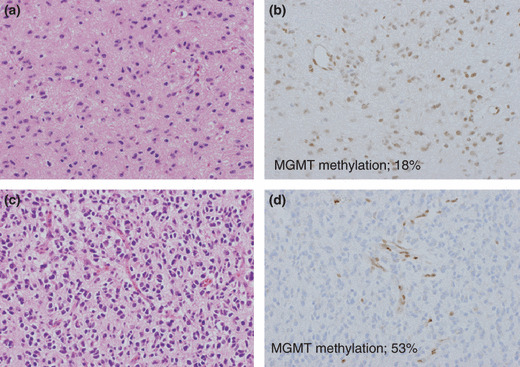
Figure 3.

Intratumoral heterogeneity of MGMT expression and pyrosequencing. One part of the tumor showed high MGMT expression with 18% methylation in the nucleus (a,b), as determined by pyrosequencing, whereas a different lesion in the same tumor showed low MGMT expression with 53% methylation (c,d). However, with methylation‐specific PCR (MSP), both these areas were found to be unmethylated. (a,c) Hematoxylin & Eosin stained sections of two different lesions in a single tumor. (b,d) MGMT immunohistochemical stained sections.
